3. Results
3.2 Experiment 1 result
Figure 5: Graph of the temperature of coffee

Figure 5.1: Table of the temperature of coffee

3.3 Experiment 2 results
Figure 6: Graph of the temperature of coffee

Figure 6.1: Table of the temperature of coffee
3.4 Experiment 3 results
Figure 7: Graph of the temperature of coffee

Figure 7.1: Graph of the temperature of coffee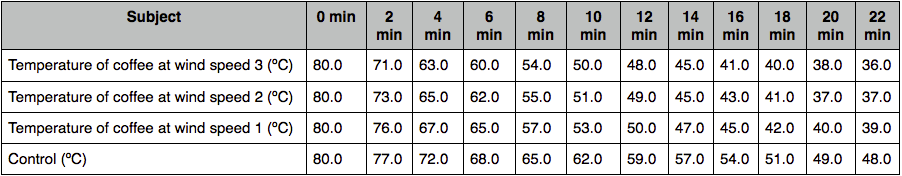
3.5 Average Results
Figure 8: Graph of average temperature 
Figure 8.1: Table of average temperature
No comments:
Post a Comment